Self-Help Knowledge
Base Articles


Channel Power (AM Spectrum XT)


Views: 0
 

Channel Power –
Provides information on differences in spectrum power vs. WiFi power


The Channel Power graph shows the maximum and average power levels for the selected power type across the channels in the selected radio band.  The X-axis shows all available channels for the selected radio band and the Y-axis shows the spectrum energy readings.
This graph view is useful for quickly pulling the channel power data out of the FFT graph.  By doing this, the graph gives the user an idea of the difference in spectrum power versus Wi-Fi power on a channel is reported by the Wi-Fi card.


Chart Configuration
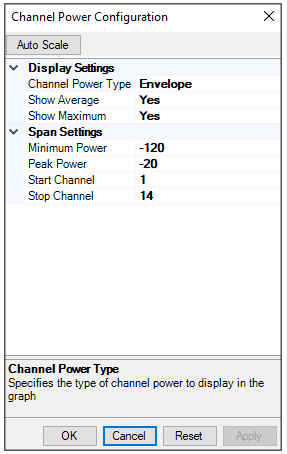


Display Settings

  • Channel Power Type
    • Envelope: Maximum or peak energy level in the channels frequency range. 
    • Integrated:  Average power of all detected power levels in the channels frequency range. 
  • Show Average: Show or hide average power indicator in the graph.
  • Show Maximum:  Show or hide maximum power indicator in the graph.

Span Settings

  • Minimum Power: Refers to the power level on the y-axis.  By default, it is set to -120 dBm, but it can be set as low as -140 dBm. 
  • Peak Power: Enables changing the maximum power level on the y-axis.  By default, it is set to -120 dBm, but it can be set to any value less than 0 dBm. 
  • Start Frequency:  Enables setting/changing of the start point of the frequency.
  • Stop Frequency:  Enables setting/changing of the end point of the frequency range.