FFT Chart –
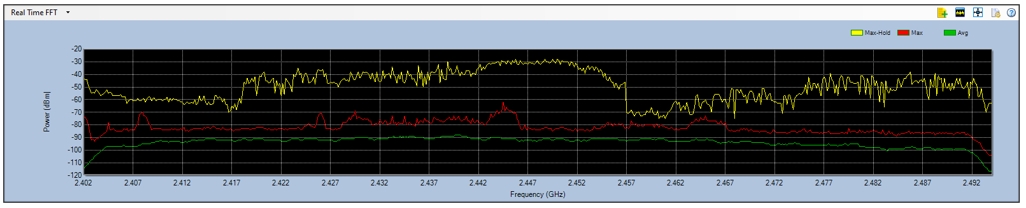
Shows overall level of energy in the band whether its transmitted by WiFi or non-WiFi interfering sources
FFT stands for Fast Fourier Transform. FFT is essentially a mathematical algorithm that correlates the value of RF power as a function of a radio frequency. It shows the relative power levels in dBm across the frequency range from the selected band.
The x-axis shows frequency range and the y-axis shows the detected power readings in dBm. This graph can phase four different types of color-coded spectrum data.
- Yellow = Max Hold: Indicates the highest power readings that have been recorded since the session began
- Red = Max: Indicates the maximum power in the RF spectrum of a single channel sweep. A sweep consists of 256 samples within a 64-millisecond sampling period.
- Green = Average: Indicates the average historical power readings recorded since the beginning of the session.
- Blue = Current: Indicates the last sample power in the RF spectrum of a single Channel sweep. (Disabled by default).
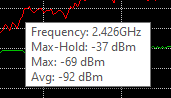
 Mousing over any frequency will display a Tool Tip that contains Max-Hold, Max, and Average information for that frequency.
 |
Chart Configuration Options: |
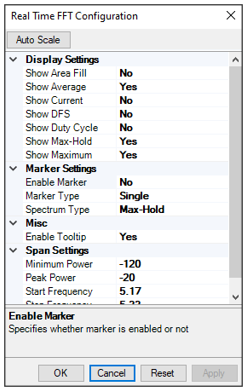 Display Settings:
- Show Area Fill: Enables a view preference to view the graph with or without fill. This option can be fairly CPU intensive; there may be improved application performance if this option is set to the default setting of No.
- Line Options: Enables control over which lines are displayed in the graph.
- Average
- Current
- DFS
- Duty Cycle
- Max-Hold
- Maximum
- Marker Settings:
- Enable Marker: enables the clicking of a point of interest in the FFT graph. If this is enabled a blue dot will appear at the click point on the graph.
- Marker Type:
- Single: displays a single marker which can be dragged to any point of interest on the FFT graph.
- Delta: displays two markers; one fixed at a particular location, and the other which can be dragged across the FFT plot for comparison.
- Misc: Enable Tooltip refers to whether to show a pop up as you mouse over the graph.
- Span Settings:
- Minimum Power: Refers to the power level on the y-axis. By default, it is set to -120 dBm, but it can be set as low as -140 dBm.
- Peak Power: Enables changing the maximum power level on the y-axis. By default, it is set to -120 dBm, but it can be set to any value less than 0 dBm.
- Start Frequency: Enables setting/changing of the start point of the frequency.
- Stop Frequency: Enables setting/changing of the end point of the frequency range.


